- Description
- Curriculum
- Reviews
The Complete Microsoft Excel Pivot Tables and Pivot Charts Course
Testimonials from Satisfied Learners
- Clark Belle Ortega: “Great course with interactive dashboards, pivot charts, pivot tables, and exercises to help students understand the course.”
- Preeti J: “I never liked Excel, but I am actually enjoying learning it the way you are teaching. Wow!”
- Pratapm537: “One of the best explained videos on pivot tables. Thank you so much for providing this video.”
- Luis Fernando: “Very good course Excellent It’s definitely one of my favorites.”
- Deepak Kumar Kanaujia: “It is very helpful and easy to understand. I have no doubts regarding pivot tables and their formatting after going through it. Thank you for the wonderful teaching and technical support.”
- Mohamed Eltantawi: “Very detailed illustration, and the instructor knows well how to use his tools. Happy to attend this course, and I believe I am going to use it a lot in my work.”
- Yousuf Saif Al Hinai: “Wonderful course. I’ve been using Excel for many years, but what I’ve learned in this course is a paradigm shift.”
- Md. Anisur Rahmen: “Wow It’s an amazing pivot tables course. I had lots of gaps on this topic, but now I have a clear concept.”
Nine Reasons to Choose This Course
- Best Rated Course on Udemy: Highly rated by learners for its quality and effectiveness.
- Data Analysis Techniques: Learn various data analysis techniques using MS Excel.
- Latest Updates and Doubt Resolution: The course is updated regularly, and doubts are solved promptly.
- Carefully Designed Curriculum: Designed by a proficient Microsoft Excel expert.
- Quick Completion: You can complete this course in a short amount of time.
- Pivot Table & Pivot Chart Examples: Includes pivot table and pivot chart-related examples and case studies.
- Downloadable Resources: 06 examples and practice exercises are available for download in the resource section.
- Prompt Instructor Support: Your queries will be responded to by the instructor in a short time.
- Verifiable Certificate: A verifiable certificate will be provided upon completion.
Importance of Pivot Tables and Pivot Charts
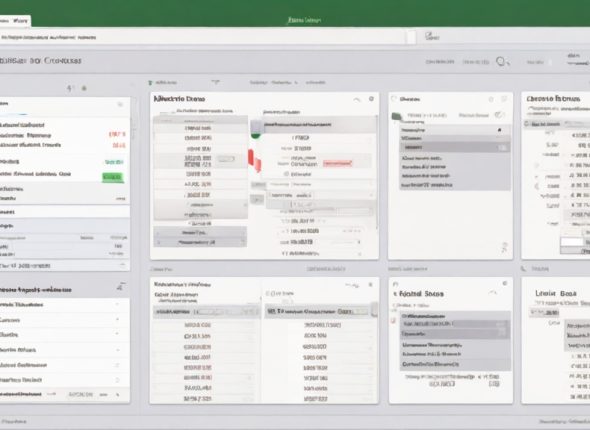
Microsoft Excel’s pivot tables and pivot charts are powerful tools for analyzing and manipulating data. They help analyze data from different perspectives, enabling important decision-making in organizations. Pivot tables allow you to see comparisons, patterns, and trends by using your data, making it easy to analyze and visualize data with Microsoft Excel.
Course Coverage
This course covers the following areas:
- Excel Pivot Table
- Pivot Charts
- Data Analysis in Excel
- Microsoft Excel Course
- Advanced Excel Skills
- Data Visualization
- Excel Data Management
- Pivot Table Tutorial
- Excel Dashboard
- Excel Analytics
What is Covered in This Course?
Here’s a detailed outline of what you’ll learn:
Chapter 01: Introduction to Pivot Tables & Pivot Charts
- Introduction to pivot tables and pivot charts.
Chapter 02: Format Data for Pivot Tables in Excel
- Normalize the data for pivot tables.
- Convert normal data to a table.
Chapter 03: Create Pivot Table and Format Values in Excel
- Create the pivot table in Excel.
- Format values in the pivot table.
Chapter 04: Expand and Collapse Pivot Table in Excel
- Expand and collapse pivot tables in Excel.
Chapter 05: Report Filter and Refresh Pivot Table in Excel
- Report filter pivot tables in Excel.
- Refresh pivot tables in Excel.
Chapter 06: Create Dynamic Dashboard & Pivot Charts from Pivot Tables
- Create bar charts (clustered bar).
- Create column charts (clustered column).
- Create pie charts (doughnut chart).
- Create 3D column charts.
- Create line charts (line with markers chart).
- Insert slicers.
Chapter 07: Managing Pivot Tables
- Connecting to an external data source.
- Creating a recommended pivot table.
- Copying and moving pivot tables.
- Deleting the pivot tables.
- Clearing & reapplying pivot tables.
- Copying values only from the pivot table.
Chapter 08: Complete Pivot Tables and Pivot Charts Exercises with Answers
- Complete exercises questions one to seven.
- Complete exercises questions eight to fourteen.
- Complete exercises questions fifteen to seventeen.
Who This Course Is For
This course is ideal for:
- Sales Managers: Individuals who use Excel for work-related tasks.
- Students: Those who need to use Excel for academic purposes.
- Individuals: Anyone who uses Excel for personal needs.
- Accountants, Auditors, Financial Analysts, Information Clerks:
Section 1: CHAPTER-01 INTRODUCTION TO PIVOT TABLES & PIVOT CHARTS
Section 2: CHAPTER-02 FORMAT DATA FOR PIVOT TABLES IN EXCEL
Section 3: CHAPTER-03 CREATE PIVOT TABLE AND FORMAT VALUES IN EXCEL
Section 4: CHAPTER-04 EXPAND AND COLLAPSE PIVOT TABLE IN EXCEL
Section 5: CHAPTER-05 REPORT FILTER AND REFRESH PIVOT TABLE IN EXCEL
Section 6: CHAPTER-06 CREATE DYNAMIC DASHBOARD & PIVOT CHARTS FROM...
Section 7: CHAPTER-07 MANAGING PIVOT TABLES
Section 8: CHAPTER-08 COMPLETE PIVOT TABLES AND PIVOT CHARTS EXERCISES...
Please, login to leave a review


